

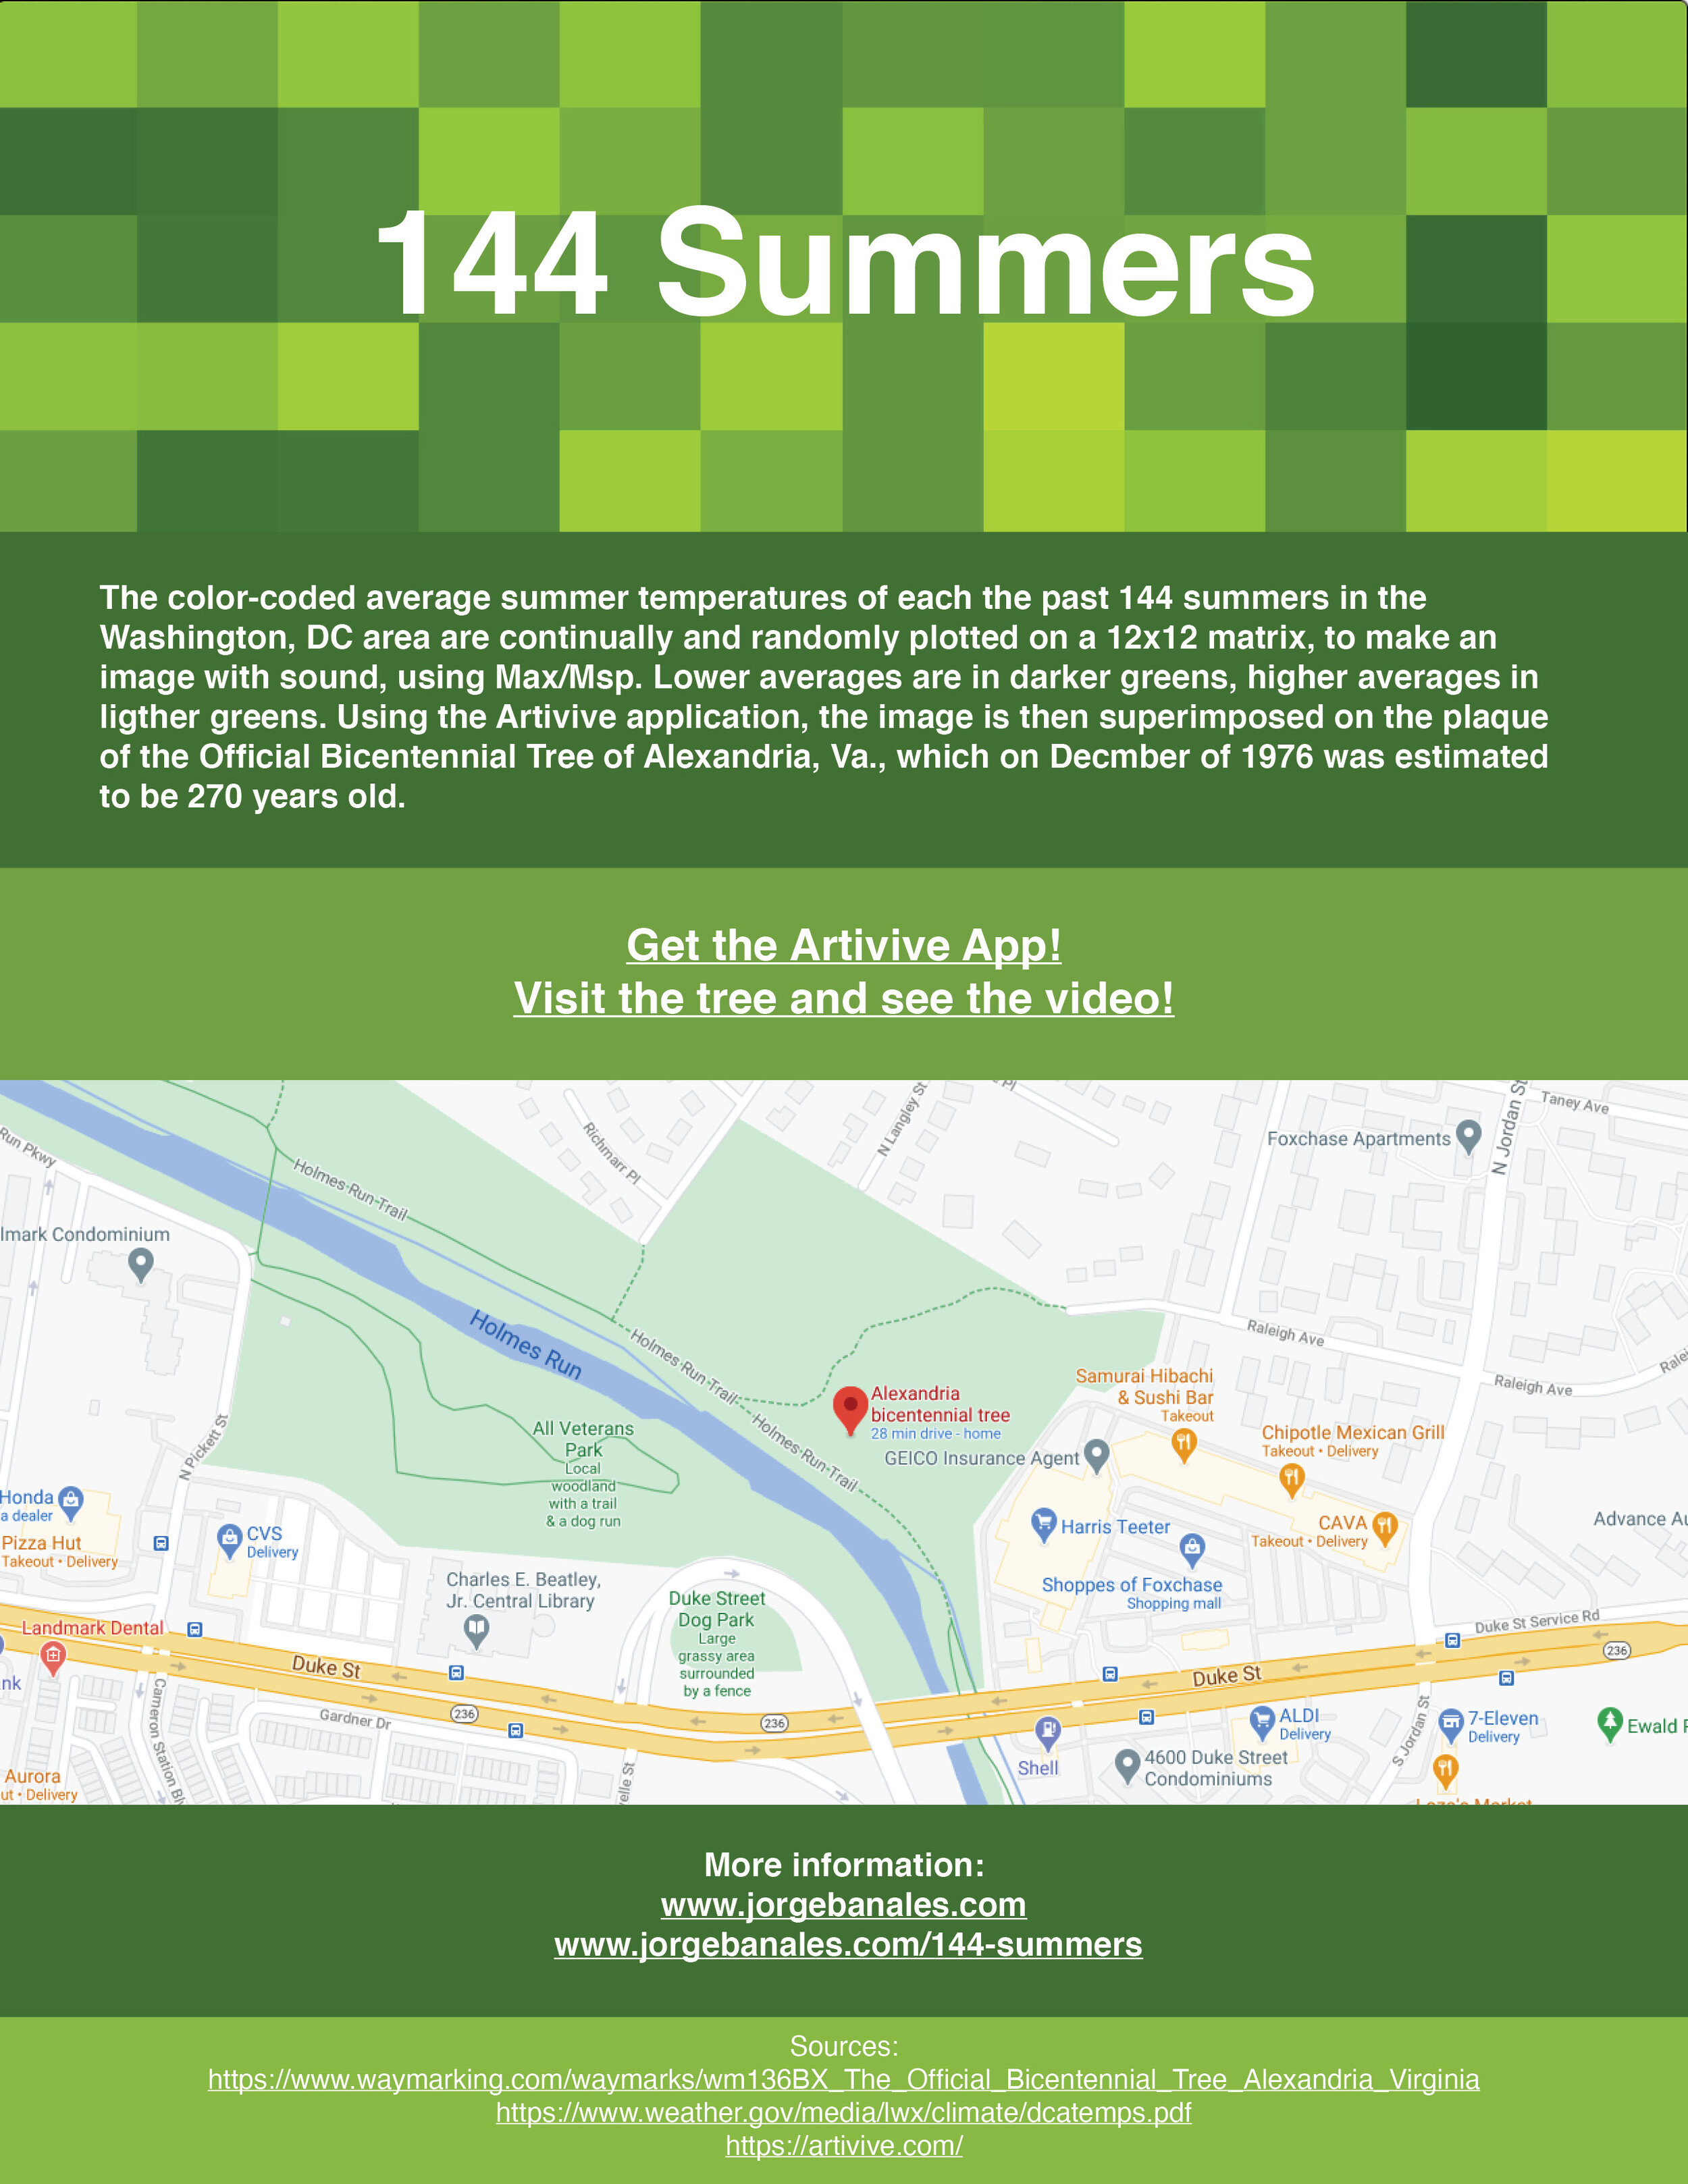

The color-coded average summer temperatures of each the past 144 summers in the Washington, DC area are continually and randomly plotted on a 12x12 matrix, to make an image with sound, using Max/Msp. Lower averages are in darker greens, higher averages in ligther greens. Using the Artivive application, the image is then superimposed on the plaque of the Official Bicentennial Tree of Alexandria, Va., which on Decmber of 1976 was estimated to be 270 years old.
Sources and links:
https://www.weather.gov/media/lwx/climate/dcatemps.pdf
Links:https://artivive.com
https://www.waymarking.com/waymarks/wm136BX_The_Official_Bicentennial_Tree_Alexandria_Virginia
Color coded and randomly placed Washington, DC average summer temperatures of the last 144 years using Max/MSP.
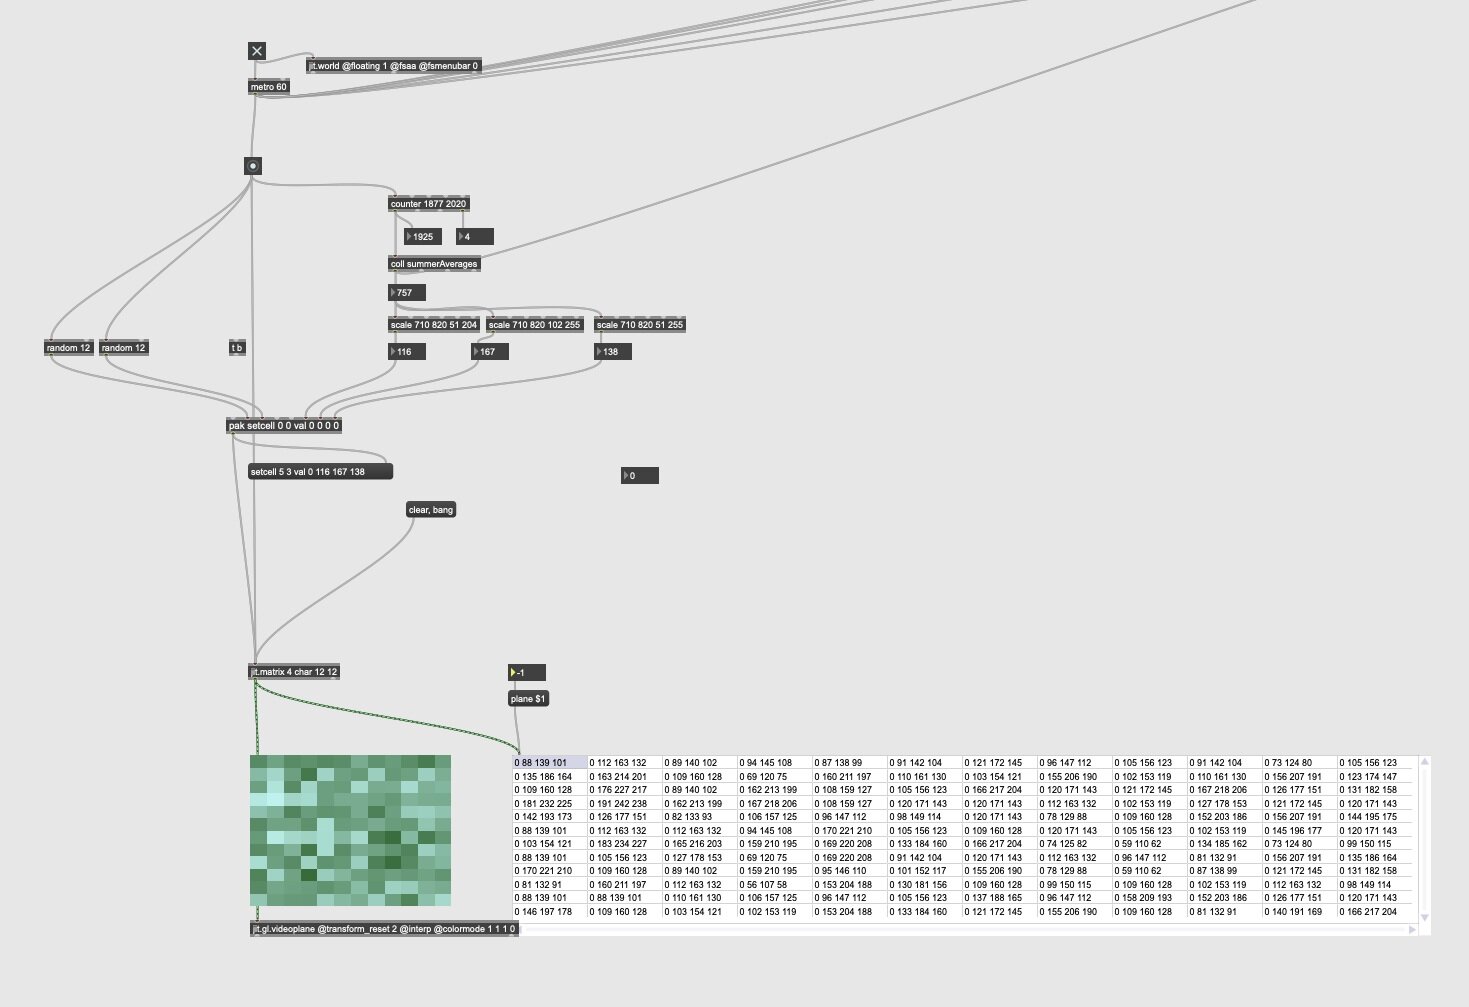
The Max/MSP patch used to make the color coded matrix.